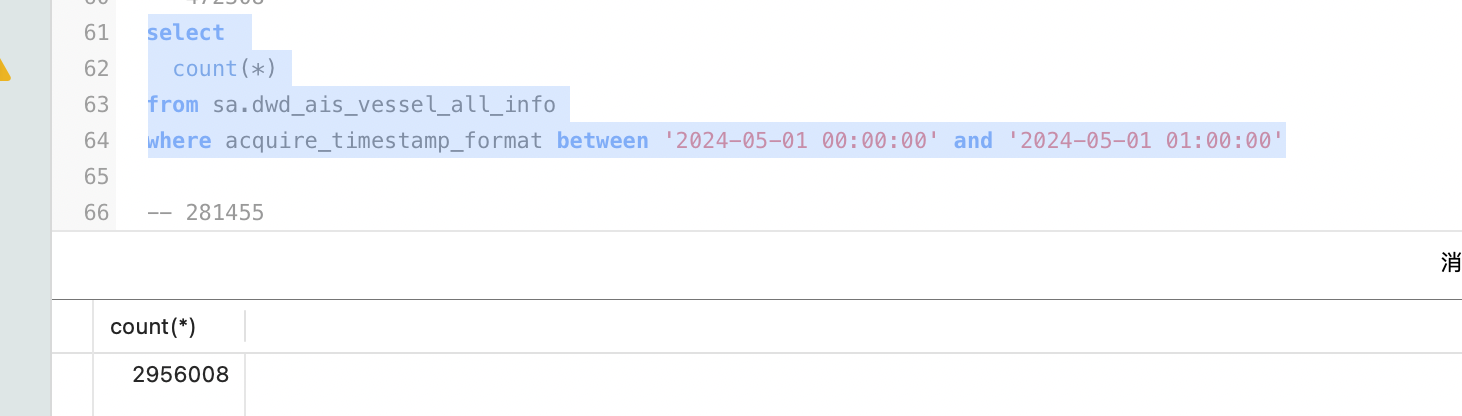
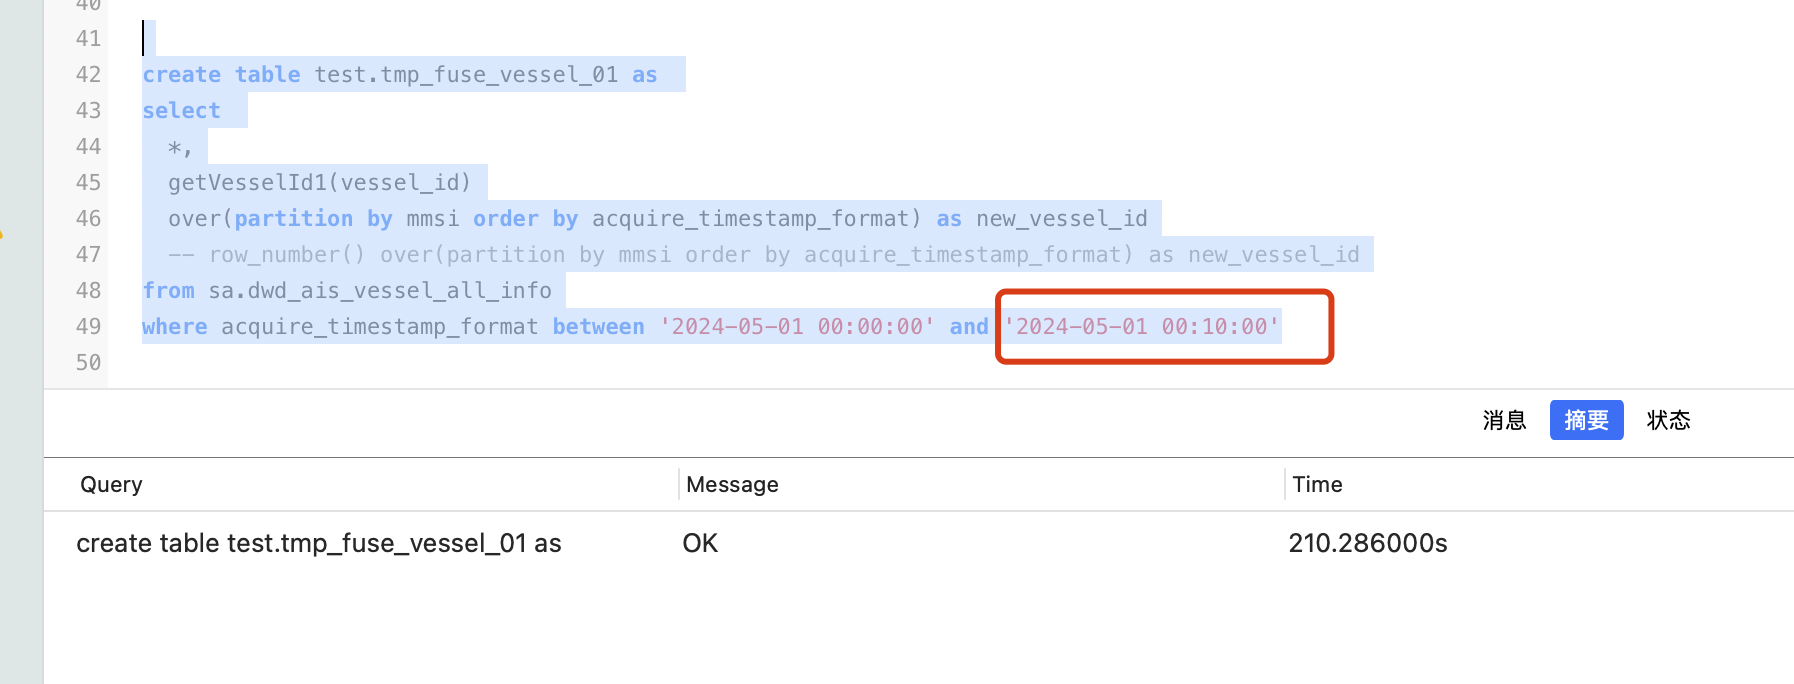
以下是我执行了52w的数据的 profile 210秒才出结果
Summary:
- Profile ID: a8a955ffc2144472-a8b0cc6cd9c373fd
- Task Type: QUERY
- Start Time: 2024-07-24 14:20:27
- End Time: 2024-07-24 14:23:58
- Total: 3m30s
- Task State: EOF
- User: admin
- Default Db: sa
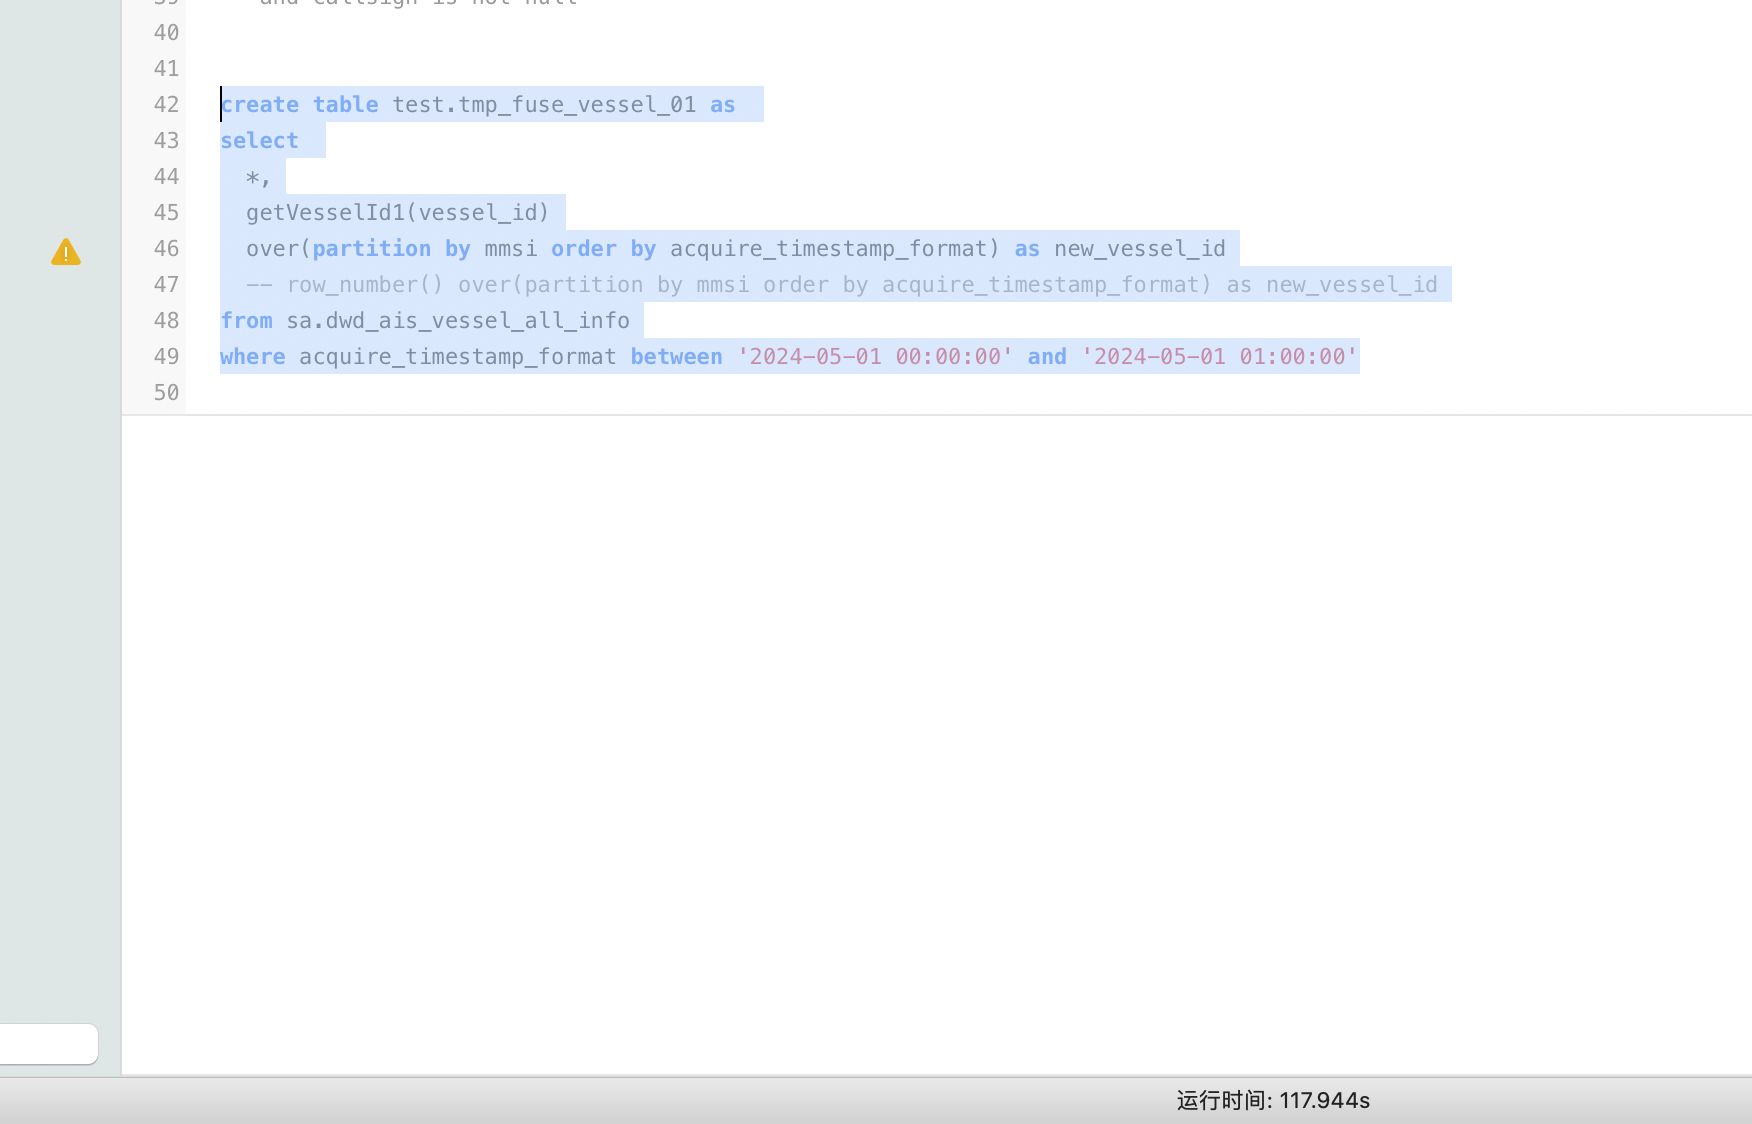
- Sql Statement: select
*,
getVesselId1(vessel_id)
over(partition by mmsi order by acquire_timestamp_format) as new_vessel_id
-- row_number() over(partition by mmsi order by acquire_timestamp_format) as new_vessel_id
from sa.dwd_ais_vessel_all_info
where acquire_timestamp_format between '2024-05-01 00:00:00' and '2024-05-01 00:10:00'
Execution Summary:
- Parse SQL Time: 28ms
- Nereids Analysis Time: 87ms
- Nereids Rewrite Time: 2s717ms
- Nereids Optimize Time: 320ms
- Nereids Translate Time: 6ms
- Workload Group: normal
- Analysis Time: 87ms
- Plan Time: 3s54ms
- JoinReorder Time: N/A
- CreateSingleNode Time: N/A
- QueryDistributed Time: N/A
- Init Scan Node Time: N/A
- Finalize Scan Node Time: N/A
- Get Splits Time: N/A
- Get Partitions Time: N/A
- Get Partition Files Time: N/A
- Create Scan Range Time: N/A
- Schedule Time: 74ms
- Fragment Assign Time: 1ms
- Fragment Serialize Time: 16ms
- Fragment RPC Phase1 Time: 34ms
- Fragment RPC Phase2 Time: 23ms
- Fragment Compressed Size: 36.25 KB
- Fragment RPC Count: 6
- Wait and Fetch Result Time: 3m27s
- Fetch Result Time: 3m26s
- Write Result Time: 1s666ms
- Doris Version: doris-2.1.4-rc03-e93678fd1e
- Is Nereids: Yes
- Is Pipeline: Yes
- Is Cached: No
- Total Instances Num: 5
- Instances Num Per BE: 172.21.30.201:30060:2,172.21.30.202:30060:2,172.21.30.203:30060:1
- Parallel Fragment Exec Instance Num: 1
- Trace ID:
- Transaction Commit Time: N/A
MergedProfile
Fragments:
Fragment 0:
Pipeline : 0(instance_num=1):
RESULT_SINK_OPERATOR (id=0):
- PlanInfo
- TABLE: sa.dwd_ais_vessel_all_info(dwd_ais_vessel_all_info), PREAGGREGATION: OFF. Reason: Predicate [(acquire_timestamp_format#1 <= 2024-05-01 00:10:00), (acquire_timestamp_format#1 >= 2024-05-01 00:00:00), (DORIS_DELETE_SIGN#37 = 0)] contains non-key column [acquire_timestamp_format#1]
- PREDICATES: (acquire_timestamp_format <= '2024-05-01 00:10:00') AND (acquire_timestamp_format >= '2024-05-01 00:00:00') AND (DORIS_DELETE_SIGN = 0)
- partitions=1/302 (p20240501)
- tablets=10/10, tabletList=38120522,38120525,38120528 ...
- cardinality=26305701, avgRowSize=0.0, numNodes=1
- pushAggOp=NONE
- projections: vessel_id, acquire_timestamp_format, acquire_timestamp, vessel_name, c_name, imo, mmsi, callsign, rate_of_turn, orientation, master_image_id, lng, lat, source, speed, speed_km, vessel_class, vessel_class_name, vessel_type, vessel_type_name, draught, cn_iso2, country_name, nav_status, nav_status_name, dimensions_01, dimensions_02, dimensions_03, dimensions_04, block_map_index, block_range_x, block_range_y, position_country_code2, friend_foe, sea_id, sea_name, update_time
- project output tuple id: 1
- BlocksProduced: sum 515, avg 515, max 515, min 515
- CloseTime: avg 7.41us, max 7.41us, min 7.41us
- ExecTime: avg 24s635ms, max 24s635ms, min 24s635ms
- InitTime: avg 94.383us, max 94.383us, min 94.383us
- InputRows: sum 0, avg 0, max 0, min 0
- MemoryUsage: sum , avg , max , min
- PeakMemoryUsage: sum 0.00 , avg 0.00 , max 0.00 , min 0.00
- OpenTime: avg 1.204ms, max 1.204ms, min 1.204ms
- RowsProduced: sum 525.726K (525726), avg 525.726K (525726), max 525.726K (525726), min 525.726K (525726)
- WaitForDependencyTime: avg 0ns, max 0ns, min 0ns
- WaitForDependency[RESULT_SINK_OPERATOR_DEPENDENCY]Time: avg 0ns, max 0ns, min 0ns
EXCHANGE_OPERATOR (id=4):
- PlanInfo
- offset: 0
- BlocksProduced: sum 1.028K (1028), avg 1.028K (1028), max 1.028K (1028), min 1.028K (1028)
- CloseTime: avg 5.159us, max 5.159us, min 5.159us
- ExecTime: avg 811.361ms, max 811.361ms, min 811.361ms
- InitTime: avg 382.845us, max 382.845us, min 382.845us
- MemoryUsage: sum , avg , max , min
- PeakMemoryUsage: sum 0.00 , avg 0.00 , max 0.00 , min 0.00
- OpenTime: avg 7.116us, max 7.116us, min 7.116us
- ProjectionTime: avg 0ns, max 0ns, min 0ns
- RowsProduced: sum 525.726K (525726), avg 525.726K (525726), max 525.726K (525726), min 525.726K (525726)
- WaitForDependencyTime: avg 0ns, max 0ns, min 0ns
- WaitForData0: avg 3m1s, max 3m1s, min 3m1s
Fragment 1:
Pipeline : 0(instance_num=1):
DATA_STREAM_SINK_OPERATOR (id=4,dst_id=4):
- BlocksProduced: sum 515, avg 515, max 515, min 515
- CloseTime: avg 33.813us, max 33.813us, min 33.813us
- ExecTime: avg 662.115ms, max 662.115ms, min 662.115ms
- InitTime: avg 88.564us, max 88.564us, min 88.564us
- InputRows: sum 525.726K (525726), avg 525.726K (525726), max 525.726K (525726), min 525.726K (525726)
- MemoryUsage: sum , avg , max , min
- PeakMemoryUsage: sum 788.00 KB, avg 788.00 KB, max 788.00 KB, min 788.00 KB
- OpenTime: avg 95.931us, max 95.931us, min 95.931us
- RowsProduced: sum 525.726K (525726), avg 525.726K (525726), max 525.726K (525726), min 525.726K (525726)
- WaitForDependencyTime: avg 0ns, max 0ns, min 0ns
- WaitForRpcBufferQueue: avg 0ns, max 0ns, min 0ns
ANALYTIC_EVAL_OPERATOR (id=3):
- PlanInfo
- functions: [sa.getvesselid1(vessel_id)]
- partition by: mmsi
- order by: acquire_timestamp_format ASC NULLS FIRST
- window: RANGE BETWEEN UNBOUNDED PRECEDING AND CURRENT ROW
- BlocksProduced: sum 514, avg 514, max 514, min 514
- CloseTime: avg 2.31ms, max 2.31ms, min 2.31ms
- ExecTime: avg 3m19s, max 3m19s, min 3m19s
- InitTime: avg 3.927us, max 3.927us, min 3.927us
- MemoryUsage: sum , avg , max , min
- Blocks: sum 0.00 , avg 0.00 , max 0.00 , min 0.00
- PeakMemoryUsage: sum 0.00 , avg 0.00 , max 0.00 , min 0.00
- OpenTime: avg 23.92ms, max 23.92ms, min 23.92ms
- ProjectionTime: avg 0ns, max 0ns, min 0ns
- RowsProduced: sum 525.726K (525726), avg 525.726K (525726), max 525.726K (525726), min 525.726K (525726)
- WaitForDependency[ANALYTIC_EVAL_OPERATOR_DEPENDENCY]Time: avg 7s573ms, max 7s573ms, min 7s573ms
Pipeline : 1(instance_num=1):
ANALYTIC_EVAL_SINK_OPERATOR (id=3):
- CloseTime: avg 0ns, max 0ns, min 0ns
- ExecTime: avg 45.163ms, max 45.163ms, min 45.163ms
- InitTime: avg 3.260us, max 3.260us, min 3.260us
- InputRows: sum 525.726K (525726), avg 525.726K (525726), max 525.726K (525726), min 525.726K (525726)
- MemoryUsage: sum , avg , max , min
- Blocks: sum 367.76 MB, avg 367.76 MB, max 367.76 MB, min 367.76 MB
- PeakMemoryUsage: sum 367.76 MB, avg 367.76 MB, max 367.76 MB, min 367.76 MB
- OpenTime: avg 31.114us, max 31.114us, min 31.114us
- WaitForDependency[ANALYTIC_EVAL_SINK_OPERATOR_DEPENDENCY]Time: avg 3m20s, max 3m20s, min 3m20s
SORT_OPERATOR (id=2):
- PlanInfo
- order by: mmsi ASC, acquire_timestamp_format ASC
- offset: 0
- BlocksProduced: sum 514, avg 514, max 514, min 514
- CloseTime: avg 0ns, max 0ns, min 0ns
- ExecTime: avg 3s192ms, max 3s192ms, min 3s192ms
- InitTime: avg 0ns, max 0ns, min 0ns
- MemoryUsage: sum , avg , max , min
- PeakMemoryUsage: sum 0.00 , avg 0.00 , max 0.00 , min 0.00
- OpenTime: avg 0ns, max 0ns, min 0ns
- ProjectionTime: avg 0ns, max 0ns, min 0ns
- RowsProduced: sum 525.726K (525726), avg 525.726K (525726), max 525.726K (525726), min 525.726K (525726)
- WaitForDependency[SORT_OPERATOR_DEPENDENCY]Time: avg 4s335ms, max 4s335ms, min 4s335ms
Pipeline : 2(instance_num=1):
SORT_SINK_OPERATOR (id=2):
- CloseTime: avg 0ns, max 0ns, min 0ns
- ExecTime: avg 1s729ms, max 1s729ms, min 1s729ms
- InitTime: avg 1.640us, max 1.640us, min 1.640us
- InputRows: sum 525.726K (525726), avg 525.726K (525726), max 525.726K (525726), min 525.726K (525726)
- MemoryUsage: sum , avg , max , min
- PeakMemoryUsage: sum 176.23 MB, avg 176.23 MB, max 176.23 MB, min 176.23 MB
- SortBlocks: sum 176.23 MB, avg 176.23 MB, max 176.23 MB, min 176.23 MB
- OpenTime: avg 280.674us, max 280.674us, min 280.674us
- WaitForDependency[SORT_SINK_OPERATOR_DEPENDENCY]Time: avg 0ns, max 0ns, min 0ns
EXCHANGE_OPERATOR (id=1):
- PlanInfo
- offset: 0
- BlocksProduced: sum 820, avg 820, max 820, min 820
- CloseTime: avg 8.123us, max 8.123us, min 8.123us
- ExecTime: avg 107.703ms, max 107.703ms, min 107.703ms
- InitTime: avg 115.868us, max 115.868us, min 115.868us
- MemoryUsage: sum , avg , max , min
- PeakMemoryUsage: sum 0.00 , avg 0.00 , max 0.00 , min 0.00
- OpenTime: avg 4.7us, max 4.7us, min 4.7us
- ProjectionTime: avg 0ns, max 0ns, min 0ns
- RowsProduced: sum 525.726K (525726), avg 525.726K (525726), max 525.726K (525726), min 525.726K (525726)
- WaitForDependencyTime: avg 0ns, max 0ns, min 0ns
- WaitForData0: avg 2s464ms, max 2s464ms, min 2s464ms
Fragment 2:
Pipeline : 0(instance_num=3):
DATA_STREAM_SINK_OPERATOR (id=1,dst_id=1):
- BlocksProduced: sum 516, avg 172, max 208, min 104
- CloseTime: avg 24.24us, max 36.561us, min 14.661us
- ExecTime: avg 154.848ms, max 234.646ms, min 49.390ms
- InitTime: avg 100.981us, max 227.728us, min 27.665us
- InputRows: sum 525.726K (525726), avg 175.242K (175242), max 211.293K (211293), min 105.286K (105286)
- MemoryUsage: sum , avg , max , min
- PeakMemoryUsage: sum 1.40 MB, avg 478.00 KB, max 748.00 KB, min 0.00
- OpenTime: avg 126.617us, max 237.640us, min 52.953us
- RowsProduced: sum 525.726K (525726), avg 175.242K (175242), max 211.293K (211293), min 105.286K (105286)
- WaitForDependencyTime: avg 0ns, max 0ns, min 0ns
- WaitForRpcBufferQueue: avg 0ns, max 0ns, min 0ns
OLAP_SCAN_OPERATOR (id=0. table name = dwd_ais_vessel_all_info(dwd_ais_vessel_all_info)):
- BlocksProduced: sum 518, avg 172, max 208, min 104
- CloseTime: avg 890.737us, max 1.458ms, min 391.1us
- ExecTime: avg 1s880ms, max 3s646ms, min 599.253ms
- InitTime: avg 283.650us, max 482.498us, min 108.126us
- MemoryUsage: sum , avg , max , min
- PeakMemoryUsage: sum 0.00 , avg 0.00 , max 0.00 , min 0.00
- OpenTime: avg 11.426ms, max 32.948ms, min 380.885us
- ProjectionTime: avg 0ns, max 0ns, min 0ns
- RowsProduced: sum 525.726K (525726), avg 175.242K (175242), max 211.293K (211293), min 105.286K (105286)
- RuntimeFilterInfo: sum , avg , max , min
- WaitForDependency[OLAP_SCAN_OPERATOR_DEPENDENCY]Time: avg 1s856ms, max 3s586ms, min 595.804ms
VScanner:
- MemoryUsage: sum , avg , max , min
- FreeBlocks: sum 88.63 MB, avg 29.54 MB, max 37.41 MB, min 18.39 MB
Execution Profile a8a955ffc2144472-a8b0cc6cd9c373fd:(Active: 3m30s, % non-child: 0.00%)
Fragments:
Fragment 0:
Pipeline :0 (host=TNetworkAddress(hostname:172.21.30.202, port:31050)):
PipelineXTask (index=0):(Active: 25s630ms, % non-child: 0.00%)
- CoreChangeTimes: 16
- ExecuteTime: 25s624ms
- CloseTime: 15.403us
- GetBlockTime: 816.990ms
- OpenTime: 1.288ms
- PrepareTime: 785.975us
- SinkTime: 24s636ms
- GetBlockCounter: 515
- NumBlockedBySinkTimes: 0
- NumBlockedBySrcTimes: 474
- NumBlockedTimes: 476
- NumScheduleTimes: 512
- NumYieldTimes: 36
- PendingFinishTimes: 0
- TaskCpuTime: 9s52ms
- WaitBfTime: 0ns
- WaitBfTimes: 0
- WaitDenpendencyTimes: 1
- WaitWorkerTime: 151.934ms
RESULT_SINK_OPERATOR (id=0):
- AppendBatchTime: 24s624ms
- CopyBufferTime: 0ns
- ResultSendTime: 4s401ms
- TupleConvertTime: 19s293ms
- BlocksProduced: 515
- BytesSent: 107.19 MB
- CloseTime: 7.41us
- ExecTime: 24s635ms
- InitTime: 94.383us
- InputRows: 0
- MemoryUsage:
- PeakMemoryUsage: 0.00
- NumSentRows: 525.726K (525726)
- OpenTime: 1.204ms
- PendingFinishDependency: 0ns
- RowsProduced: 525.726K (525726)
- WaitForDependencyTime: 0ns
- WaitForDependency[RESULT_SINK_OPERATOR_DEPENDENCY]Time: 0ns
EXCHANGE_OPERATOR (id=4):
- BlocksProduced: 1.028K (1028)
- BytesReceived: 85.64 MB
- CloseTime: 5.159us
- DataArrivalWaitTime: 0ns
- DecompressBytes: 0.00
- DecompressTime: 0ns
- DeserializeRowBatchTimer: 6s249ms
- ExecTime: 811.361ms
- FirstBatchArrivalWaitTime: 0ns
- InitTime: 382.845us
- LocalBytesReceived: 0.00
- MemoryUsage:
- Blocks: 3.35 MB
- PeakMemoryUsage: 0.00
- OpenTime: 7.116us
- ProjectionTime: 0ns
- RowsProduced: 525.726K (525726)
- SendersBlockedTotalTimer(): 0ns
- WaitForDependencyTime: 0ns
- WaitForData0: 3m1s
Fragment 1:
Pipeline :0 (host=TNetworkAddress(hostname:172.21.30.201, port:31050)):
PipelineXTask (index=0):(Active: 3m20s, % non-child: 0.00%)
- CoreChangeTimes: 10
- ExecuteTime: 3m20s
- CloseTime: 2.72ms
- GetBlockTime: 3m19s
- OpenTime: 23.203ms
- PrepareTime: 197.126us
- SinkTime: 663.44ms
- GetBlockCounter: 1.026K (1026)
- NumBlockedBySinkTimes: 0
- NumBlockedBySrcTimes: 512
- NumBlockedTimes: 514
- NumScheduleTimes: 515
- NumYieldTimes: 0
- PendingFinishTimes: 1
- TaskCpuTime: 3m13s
- WaitBfTime: 0ns
- WaitBfTimes: 0
- WaitDenpendencyTimes: 1
- WaitWorkerTime: 10.307ms
DATA_STREAM_SINK_OPERATOR (id=4,dst_id=4):
- BlocksProduced: 515
- BrpcSendTime: 0ns
- BrpcSendTime.Wait: 0ns
- BytesSent: 85.29 MB
- CloseTime: 33.813us
- CompressTime: 0ns
- ExecTime: 662.115ms
- InitTime: 88.564us
- InputRows: 525.726K (525726)
- LocalBytesSent: 0.00
- LocalSendTime: 0ns
- LocalSentRows: 0
- MemoryUsage:
- PeakMemoryUsage: 788.00 KB
- MergeBlockTime: 96.204ms
- OpenTime: 95.931us
- OverallThroughput: 0.0 /sec
- PendingFinishDependency: 6.14ms
- RowsProduced: 525.726K (525726)
- RpcAvgTime: 10.201ms
- RpcCount: 514
- RpcMaxTime: 5s243ms
- RpcMinTime: 5s243ms
- RpcSumTime: 5s243ms
- SerializeBatchTime: 343.578ms
- SplitBlockDistributeByChannelTime: 0ns
- SplitBlockHashComputeTime: 0ns
- UncompressedRowBatchSize: 190.78 MB
- WaitForDependencyTime: 0ns
- WaitForBroadcastBuffer: 0ns
- WaitForRpcBufferQueue: 0ns
ANALYTIC_EVAL_OPERATOR (id=3):
- BlocksProduced: 514
- CloseTime: 2.31ms
- EvaluationTime: 334.385ms
- ExecTime: 3m19s
- InitTime: 3.927us
- MemoryUsage:
- Blocks: 0.00
- PeakMemoryUsage: 0.00
- OpenTime: 23.92ms
- ProjectionTime: 0ns
- RowsProduced: 525.726K (525726)
- WaitForDependency[ANALYTIC_EVAL_OPERATOR_DEPENDENCY]Time: 7s573ms
Pipeline :1 (host=TNetworkAddress(hostname:172.21.30.201, port:31050)):
PipelineXTask (index=1):(Active: 3s255ms, % non-child: 0.00%)
- CoreChangeTimes: 9
- ExecuteTime: 3s255ms
- CloseTime: 3.24us
- GetBlockTime: 3s195ms
- OpenTime: 43.428us
- PrepareTime: 88.188us
- SinkTime: 46.363ms
- GetBlockCounter: 515
- NumBlockedBySinkTimes: 511
- NumBlockedBySrcTimes: 1
- NumBlockedTimes: 514
- NumScheduleTimes: 514
- NumYieldTimes: 0
- PendingFinishTimes: 0
- TaskCpuTime: 3s176ms
- WaitBfTime: 0ns
- WaitBfTimes: 0
- WaitDenpendencyTimes: 1
- WaitWorkerTime: 18.0ms
ANALYTIC_EVAL_SINK_OPERATOR (id=3):
- CloseTime: 0ns
- EvaluationTime: 1.192ms
- ExecTime: 45.163ms
- InitTime: 3.260us
- InputRows: 525.726K (525726)
- MemoryUsage:
- Blocks: 367.76 MB
- PeakMemoryUsage: 367.76 MB
- OpenTime: 31.114us
- PendingFinishDependency: 0ns
- WaitForDependency[ANALYTIC_EVAL_SINK_OPERATOR_DEPENDENCY]Time: 3m20s
SORT_OPERATOR (id=2):
- BlocksProduced: 514
- CloseTime: 0ns
- ExecTime: 3s192ms
- InitTime: 0ns
- MemoryUsage:
- PeakMemoryUsage: 0.00
- OpenTime: 0ns
- ProjectionTime: 0ns
- RowsProduced: 525.726K (525726)
- WaitForDependency[SORT_OPERATOR_DEPENDENCY]Time: 4s335ms
Pipeline :2 (host=TNetworkAddress(hostname:172.21.30.201, port:31050)):
PipelineXTask (index=2):(Active: 1s853ms, % non-child: 0.00%)
- CoreChangeTimes: 3
- ExecuteTime: 1s853ms
- CloseTime: 14.202us
- GetBlockTime: 108.687ms
- OpenTime: 291.653us
- PrepareTime: 180.27us
- SinkTime: 1s729ms
- GetBlockCounter: 515
- NumBlockedBySinkTimes: 0
- NumBlockedBySrcTimes: 291
- NumBlockedTimes: 293
- NumScheduleTimes: 295
- NumYieldTimes: 2
- PendingFinishTimes: 0
- TaskCpuTime: 1s830ms
- WaitBfTime: 0ns
- WaitBfTimes: 0
- WaitDenpendencyTimes: 1
- WaitWorkerTime: 19.331ms
SORT_SINK_OPERATOR (id=2):
- TOP-N: false
- CloseTime: 0ns
- ExecTime: 1s729ms
- InitTime: 1.640us
- InputRows: 525.726K (525726)
- MemoryUsage:
- PeakMemoryUsage: 176.23 MB
- SortBlocks: 176.23 MB
- MergeBlockTime: 326.723ms
- OpenTime: 280.674us
- PartialSortTime: 1s397ms
- PendingFinishDependency: 0ns
- WaitForDependency[SORT_SINK_OPERATOR_DEPENDENCY]Time: 0ns
EXCHANGE_OPERATOR (id=1):
- BlocksProduced: 820
- BytesReceived: 53.16 MB
- CloseTime: 8.123us
- DataArrivalWaitTime: 0ns
- DecompressBytes: 0.00
- DecompressTime: 0ns
- DeserializeRowBatchTimer: 382.370ms
- ExecTime: 107.703ms
- FirstBatchArrivalWaitTime: 0ns
- InitTime: 115.868us
- LocalBytesReceived: 158.32 MB
- MemoryUsage:
- Blocks: 20.10 MB
- PeakMemoryUsage: 0.00
- OpenTime: 4.7us
- ProjectionTime: 0ns
- RowsProduced: 525.726K (525726)
- SendersBlockedTotalTimer(): 105.314ms
- WaitForDependencyTime: 0ns
- WaitForData0: 2s464ms
Fragment 2:
Pipeline :0 (host=TNetworkAddress(hostname:172.21.30.203, port:31050)):
PipelineXTask (index=0):(Active: 54.198ms, % non-child: 0.00%)
- CoreChangeTimes: 0
- ExecuteTime: 53.126ms
- CloseTime: 408.881us
- GetBlockTime: 2.622ms
- OpenTime: 439.871us
- PrepareTime: 211.243us
- SinkTime: 49.325ms
- GetBlockCounter: 104
- NumBlockedBySinkTimes: 5
- NumBlockedBySrcTimes: 8
- NumBlockedTimes: 15
- NumScheduleTimes: 16
- NumYieldTimes: 0
- PendingFinishTimes: 1
- TaskCpuTime: 53.476ms
- WaitBfTime: 0ns
- WaitBfTimes: 0
- WaitDenpendencyTimes: 1
- WaitWorkerTime: 393.337us
DATA_STREAM_SINK_OPERATOR (id=1,dst_id=1):
- Partitioner: Crc32HashPartitioner(1)
- BlocksProduced: 104
- BrpcSendTime: 0ns
- BrpcSendTime.Wait: 0ns
- BytesSent: 17.73 MB
- CloseTime: 14.661us
- CompressTime: 0ns
- ExecTime: 49.390ms
- InitTime: 27.665us
- InputRows: 105.286K (105286)
- LocalBytesSent: 0.00
- LocalSendTime: 0ns
- LocalSentRows: 0
- MemoryUsage:
- PeakMemoryUsage: 686.00 KB
- MergeBlockTime: 10.119ms
- OpenTime: 52.953us
- OverallThroughput: 0.0 /sec
- PendingFinishDependency: 8.97ms
- RowsProduced: 105.286K (105286)
- RpcAvgTime: 327.937us
- RpcCount: 103
- RpcMaxTime: 33.777ms
- RpcMinTime: 33.777ms
- RpcSumTime: 33.777ms
- SerializeBatchTime: 35.877ms
- SplitBlockDistributeByChannelTime: 0ns
- SplitBlockHashComputeTime: 0ns
- UncompressedRowBatchSize: 37.26 MB
- WaitForDependencyTime: 0ns
- WaitForBroadcastBuffer: 35.357ms
- WaitForRpcBufferQueue: 0ns
OLAP_SCAN_OPERATOR (id=0. table name = dwd_ais_vessel_all_info(dwd_ais_vessel_all_info)):
- RuntimeFilters: :
- PushDownPredicates: [{acquire_timestamp_format >= [2024-05-01 00:00:00]}, {acquire_timestamp_format <= [2024-05-01 00:10:00]}, {DORIS_DELETE_SIGN IN [0]}]
- KeyRanges: ScanKeys:ScanKey=[null(-9223372036854775808) : 9223372036854775807]
- TabletIds: [38120531, 38120549]
- RemainedDownPredicates: VectorizedFn[VectorizedFnCall[eq](arguments=DORIS_DELETE_SIGN, Int8,return=UInt8)]{
SlotRef(slot_id=37 type=TINYINT),
VLiteral (name = Int8, type = Int8, value = (0))}
- UseSpecificThreadToken: False
- AcquireRuntimeFilterTime: 682ns
- BlocksProduced: 104
- CloseTime: 391.1us
- ExecTime: 599.253ms
- InitTime: 108.126us
- KeyRangesNum: 2
- MaxScannerThreadNum: 2
- MemoryUsage:
- PeakMemoryUsage: 0.00
- NumScanners: 2
- OpenTime: 380.885us
- ProcessConjunctTime: 210.903us
- ProjectionTime: 0ns
- RowsProduced: 105.286K (105286)
- RowsRead: 105.286K (105286)
- RuntimeFilterInfo:
- ScannerWorkerWaitTime: 433.218us
- TabletNum: 2
- TotalReadThroughput: 0
- WaitForDependency[OLAP_SCAN_OPERATOR_DEPENDENCY]Time: 595.804ms
- WaitForRuntimeFilter: 0ns
VScanner:
- ReadColumns: [vessel_id, acquire_timestamp_format, acquire_timestamp, vessel_name, c_name, imo, mmsi, callsign, rate_of_turn, orientation, master_image_id
, lng, lat, source, speed, speed_km, vessel_class, vessel_class_name, vessel_type, vessel_type_name, draught, cn_iso2
, country_name, nav_status, nav_status_name, dimensions_01, dimensions_02, dimensions_03, dimensions_04, block_map_index, block_range_x, block_range_y, position_country_code2
, friend_foe, sea_id, sea_name, update_time, DORIS_DELETE_SIGN]
- PreEvaluatePredicates:
ComparisonPredicateBase(DATETIME, LE), column_id=1, opposite=false
ComparisonPredicateBase(TINYINT, EQ), column_id=37, opposite=false
- PerScannerRunningTime: [651.291ms, 486.330ms, ]
- PerScannerRowsRead: [52.83K, 52.46K, ]
- PerScannerWaitTime: [185.870us, 247.348us, ]
- PerScannerProjectionTime: [7.715ms, 8.029ms, ]
- BlockConvertTime: 0ns
- BlockFetchTime: 950.539ms
- DeleteBitmapGetAggTime: 0ns
- MemoryUsage:
- FreeBlocks: 18.39 MB
- NewlyCreateFreeBlocksNum: 0
- NumScaleUpScanners: 0
- ReaderInitTime: 8.218ms
- RowsDelFiltered: 0
- ScannerBatchWaitTime: 4.290us
- ScannerConvertBlockTime: 0ns
- ScannerCpuTime: 1s154ms
- ScannerCtxSchedTime: 417.889us
- ScannerFilterTime: 2.45ms
- ScannerGetBlockTime: 1s119ms
- ScannerInitTime: 77.415us
- ScannerPrefilterTime: 0ns
- ScannerSchedCount: 8
SegmentIterator:
- BitmapIndexFilterTimer: 2.869us
- BlockConditionsFilteredBloomFilterTime: 3.731us
- BlockConditionsFilteredDictTime: 1.422us
- BlockConditionsFilteredTime: 298.434us
- BlockConditionsFilteredZonemapRuntimePredicateTime: 0ns
- BlockConditionsFilteredZonemapTime: 263.222us
- BlockInitSeekCount: 34
- BlockInitSeekTime: 49.176us
- BlockInitTime: 484.288us
- BlockLoadTime: 956.123ms
- BlocksLoad: 4.365K (4365)
- CachedPagesNum: 9.5K (9500)
- CollectIteratorMergeTime: 0ns
- CollectIteratorNormalTime: 0ns
- CompressedBytesRead: 0.00
- DecompressorTimer: 0ns
- ExprFilterEvalTime: 0ns
- FirstReadSeekCount: 8.938K (8938)
- FirstReadSeekTime: 6.64ms
- FirstReadTime: 108.682ms
- IOTimer: 0ns
- InvertedIndexFilterTime: 5.245us
- InvertedIndexQueryBitmapCopyTime: 0ns
- InvertedIndexQueryBitmapOpTime: 0ns
- InvertedIndexQueryCacheHit: 0
- InvertedIndexQueryCacheMiss: 0
- InvertedIndexQueryTime: 0ns
- InvertedIndexSearcherOpenTime: 0ns
- InvertedIndexSearcherSearchTime: 0ns
- LazyReadSeekCount: 0
- LazyReadSeekTime: 0ns
- LazyReadTime: 754.306ms
- NumSegmentFiltered: 1
- NumSegmentTotal: 5
- OutputColumnTime: 4.898ms
- OutputIndexResultColumnTimer: 506.327us
- RawRowsRead: 4.464241M (4464241)
- RowsBitmapIndexFiltered: 0
- RowsBloomFilterFiltered: 0
- RowsConditionsFiltered: 0
- RowsDictFiltered: 0
- RowsInvertedIndexFiltered: 0
- RowsKeyRangeFiltered: 0
- RowsShortCircuitPredFiltered: 0
- RowsShortCircuitPredInput: 0
- RowsStatsFiltered: 0
- RowsVectorPredFiltered: 4.352979M (4352979)
- RowsVectorPredInput: 4.458265M (4458265)
- RowsZonemapRuntimePredicateFiltered: 0
- SecondReadTime: 0ns
- ShortPredEvalTime: 127.334us
- TotalPagesNum: 9.5K (9500)
- UncompressedBytesRead: 0.00
- VectorPredEvalTime: 18.132ms
Pipeline :0 (host=TNetworkAddress(hostname:172.21.30.201, port:31050)):
PipelineXTask (index=0):(Active: 193.187ms, % non-child: 0.00%)
- CoreChangeTimes: 0
- ExecuteTime: 190.759ms
- CloseTime: 846.758us
- GetBlockTime: 7.512ms
- OpenTime: 1.93ms
- PrepareTime: 467.130us
- SinkTime: 180.472ms
- GetBlockCounter: 208
- NumBlockedBySinkTimes: 1
- NumBlockedBySrcTimes: 11
- NumBlockedTimes: 14
- NumScheduleTimes: 14
- NumYieldTimes: 0
- PendingFinishTimes: 0
- TaskCpuTime: 183.479ms
- WaitBfTime: 0ns
- WaitBfTimes: 0
- WaitDenpendencyTimes: 1
- WaitWorkerTime: 423.756us
DATA_STREAM_SINK_OPERATOR (id=1,dst_id=1):
- Partitioner: Crc32HashPartitioner(1)
- BlocksProduced: 208
- BrpcSendTime: 0ns
- BrpcSendTime.Wait: 0ns
- BytesSent: 0.00
- CloseTime: 20.852us
- CompressTime: 0ns
- ExecTime: 180.509ms
- InitTime: 47.551us
- InputRows: 211.293K (211293)
- LocalBytesSent: 70.82 MB
- LocalSendTime: 180.83ms
- LocalSentRows: 211.293K (211293)
- MemoryUsage:
- PeakMemoryUsage: 0.00
- MergeBlockTime: 0ns
- OpenTime: 89.258us
- OverallThroughput: 0.0 /sec
- PendingFinishDependency: 0ns
- RowsProduced: 211.293K (211293)
- RpcAvgTime: 0ns
- RpcCount: 0
- RpcMaxTime: 0ns
- RpcMinTime: 0ns
- RpcSumTime: 0ns
- SerializeBatchTime: 0ns
- SplitBlockDistributeByChannelTime: 0ns
- SplitBlockHashComputeTime: 0ns
- UncompressedRowBatchSize: 0.00
- WaitForDependencyTime: 0ns
- WaitForLocalExchangeBuffer0: 271.901ms
- WaitForRpcBufferQueue: 0ns
OLAP_SCAN_OPERATOR (id=0. table name = dwd_ais_vessel_all_info(dwd_ais_vessel_all_info)):
- RuntimeFilters: :
- PushDownPredicates: [{acquire_timestamp_format >= [2024-05-01 00:00:00]}, {acquire_timestamp_format <= [2024-05-01 00:10:00]}, {DORIS_DELETE_SIGN IN [0]}]
- KeyRanges: ScanKeys:ScanKey=[null(-9223372036854775808) : 9223372036854775807]
- TabletIds: [38120525, 38120534, 38120540, 38120546]
- RemainedDownPredicates: VectorizedFn[VectorizedFnCall[eq](arguments=DORIS_DELETE_SIGN, Int8,return=UInt8)]{
SlotRef(slot_id=37 type=TINYINT),
VLiteral (name = Int8, type = Int8, value = (0))}
- UseSpecificThreadToken: False
- AcquireRuntimeFilterTime: 1.333us
- BlocksProduced: 208
- CloseTime: 822.257us
- ExecTime: 1s395ms
- InitTime: 260.328us
- KeyRangesNum: 4
- MaxScannerThreadNum: 4
- MemoryUsage:
- PeakMemoryUsage: 0.00
- NumScanners: 4
- OpenTime: 950.753us
- ProcessConjunctTime: 447.646us
- ProjectionTime: 0ns
- RowsProduced: 211.293K (211293)
- RowsRead: 211.293K (211293)
- RuntimeFilterInfo:
- ScannerWorkerWaitTime: 2.952ms
- TabletNum: 4
- TotalReadThroughput: 0
- WaitForDependency[OLAP_SCAN_OPERATOR_DEPENDENCY]Time: 1s386ms
- WaitForRuntimeFilter: 0ns
VScanner:
- ReadColumns: [vessel_id, acquire_timestamp_format, acquire_timestamp, vessel_name, c_name, imo, mmsi, callsign, rate_of_turn, orientation, master_image_id
, lng, lat, source, speed, speed_km, vessel_class, vessel_class_name, vessel_type, vessel_type_name, draught, cn_iso2
, country_name, nav_status, nav_status_name, dimensions_01, dimensions_02, dimensions_03, dimensions_04, block_map_index, block_range_x, block_range_y, position_country_code2
, friend_foe, sea_id, sea_name, update_time, DORIS_DELETE_SIGN]
- PreEvaluatePredicates:
ComparisonPredicateBase(DATETIME, LE), column_id=1, opposite=false
ComparisonPredicateBase(TINYINT, EQ), column_id=37, opposite=false
- PerScannerRunningTime: [1s448ms, 1s465ms, 1s455ms, 1s223ms, ]
- PerScannerRowsRead: [52.22K, 52.23K, 53.17K, 53.68K, ]
- PerScannerWaitTime: [1.038ms, 187.262us, 610.784us, 1.115ms, ]
- PerScannerProjectionTime: [27.100ms, 23.829ms, 21.067ms, 26.943ms, ]
- BlockConvertTime: 0ns
- BlockFetchTime: 4s551ms
- DeleteBitmapGetAggTime: 0ns
- MemoryUsage:
- FreeBlocks: 37.41 MB
- NewlyCreateFreeBlocksNum: 0
- NumScaleUpScanners: 0
- ReaderInitTime: 39.67ms
- RowsDelFiltered: 0
- ScannerBatchWaitTime: 19.605us
- ScannerConvertBlockTime: 0ns
- ScannerCpuTime: 5s638ms
- ScannerCtxSchedTime: 2.131ms
- ScannerFilterTime: 10.792ms
- ScannerGetBlockTime: 5s482ms
- ScannerInitTime: 265.671us
- ScannerPrefilterTime: 0ns
- ScannerSchedCount: 16
SegmentIterator:
- BitmapIndexFilterTimer: 10.454us
- BlockConditionsFilteredBloomFilterTime: 15.985us
- BlockConditionsFilteredDictTime: 4.476us
- BlockConditionsFilteredTime: 1.876ms
- BlockConditionsFilteredZonemapRuntimePredicateTime: 0ns
- BlockConditionsFilteredZonemapTime: 1.732ms
- BlockInitSeekCount: 70
- BlockInitSeekTime: 222.607us
- BlockInitTime: 2.716ms
- BlockLoadTime: 4s577ms
- BlocksLoad: 9.574K (9574)
- CachedPagesNum: 20.796K (20796)
- CollectIteratorMergeTime: 0ns
- CollectIteratorNormalTime: 0ns
- CompressedBytesRead: 0.00
- DecompressorTimer: 0ns
- ExprFilterEvalTime: 0ns
- FirstReadSeekCount: 19.564K (19564)
- FirstReadSeekTime: 30.409ms
- FirstReadTime: 506.170ms
- IOTimer: 0ns
- InvertedIndexFilterTime: 19.284us
- InvertedIndexQueryBitmapCopyTime: 0ns
- InvertedIndexQueryBitmapOpTime: 0ns
- InvertedIndexQueryCacheHit: 0
- InvertedIndexQueryCacheMiss: 0
- InvertedIndexQueryTime: 0ns
- InvertedIndexSearcherOpenTime: 0ns
- InvertedIndexSearcherSearchTime: 0ns
- LazyReadSeekCount: 0
- LazyReadSeekTime: 0ns
- LazyReadTime: 3s615ms
- NumSegmentFiltered: 1
- NumSegmentTotal: 9
- OutputColumnTime: 25.594ms
- OutputIndexResultColumnTimer: 2.633ms
- RawRowsRead: 9.794285M (9794285)
- RowsBitmapIndexFiltered: 0
- RowsBloomFilterFiltered: 0
- RowsConditionsFiltered: 173
- RowsDictFiltered: 0
- RowsInvertedIndexFiltered: 0
- RowsKeyRangeFiltered: 0
- RowsShortCircuitPredFiltered: 0
- RowsShortCircuitPredInput: 0
- RowsStatsFiltered: 173
- RowsVectorPredFiltered: 9.571031M (9571031)
- RowsVectorPredInput: 9.782324M (9782324)
- RowsZonemapRuntimePredicateFiltered: 0
- SecondReadTime: 0ns
- ShortPredEvalTime: 484.712us
- TotalPagesNum: 20.796K (20796)
- UncompressedBytesRead: 0.00
- VectorPredEvalTime: 88.473ms
Pipeline :0 (host=TNetworkAddress(hostname:172.21.30.202, port:31050)):
PipelineXTask (index=0):(Active: 331.521ms, % non-child: 0.00%)
- CoreChangeTimes: 0
- ExecuteTime: 295.343ms
- CloseTime: 1.502ms
- GetBlockTime: 24.937ms
- OpenTime: 33.420ms
- PrepareTime: 1.223ms
- SinkTime: 234.307ms
- GetBlockCounter: 206
- NumBlockedBySinkTimes: 0
- NumBlockedBySrcTimes: 15
- NumBlockedTimes: 17
- NumScheduleTimes: 18
- NumYieldTimes: 0
- PendingFinishTimes: 1
- TaskCpuTime: 188.206ms
- WaitBfTime: 0ns
- WaitBfTimes: 0
- WaitDenpendencyTimes: 1
- WaitWorkerTime: 1.856ms
DATA_STREAM_SINK_OPERATOR (id=1,dst_id=1):
- Partitioner: Crc32HashPartitioner(1)
- BlocksProduced: 204
- BrpcSendTime: 0ns
- BrpcSendTime.Wait: 0ns
- BytesSent: 35.23 MB
- CloseTime: 36.561us
- CompressTime: 0ns
- ExecTime: 234.646ms
- InitTime: 227.728us
- InputRows: 209.147K (209147)
- LocalBytesSent: 0.00
- LocalSendTime: 0ns
- LocalSentRows: 0
- MemoryUsage:
- PeakMemoryUsage: 748.00 KB
- MergeBlockTime: 52.817ms
- OpenTime: 237.640us
- OverallThroughput: 0.0 /sec
- PendingFinishDependency: 49.939ms
- RowsProduced: 209.147K (209147)
- RpcAvgTime: 5.790ms
- RpcCount: 203
- RpcMaxTime: 1s175ms
- RpcMinTime: 1s175ms
- RpcSumTime: 1s175ms
- SerializeBatchTime: 157.820ms
- SplitBlockDistributeByChannelTime: 0ns
- SplitBlockHashComputeTime: 0ns
- UncompressedRowBatchSize: 73.97 MB
- WaitForDependencyTime: 0ns
- WaitForBroadcastBuffer: 0ns
- WaitForRpcBufferQueue: 0ns
OLAP_SCAN_OPERATOR (id=0. table name = dwd_ais_vessel_all_info(dwd_ais_vessel_all_info)):
- RuntimeFilters: :
- PushDownPredicates: [{acquire_timestamp_format >= [2024-05-01 00:00:00]}, {acquire_timestamp_format <= [2024-05-01 00:10:00]}, {DORIS_DELETE_SIGN IN [0]}]
- KeyRanges: ScanKeys:ScanKey=[null(-9223372036854775808) : 9223372036854775807]
- TabletIds: [38120522, 38120528, 38120537, 38120543]
- RemainedDownPredicates: VectorizedFn[VectorizedFnCall[eq](arguments=DORIS_DELETE_SIGN, Int8,return=UInt8)]{
SlotRef(slot_id=37 type=TINYINT),
VLiteral (name = Int8, type = Int8, value = (0))}
- UseSpecificThreadToken: False
- AcquireRuntimeFilterTime: 1.834us
- BlocksProduced: 206
- CloseTime: 1.458ms
- ExecTime: 3s646ms
- InitTime: 482.498us
- KeyRangesNum: 4
- MaxScannerThreadNum: 4
- MemoryUsage:
- PeakMemoryUsage: 0.00
- NumScanners: 4
- OpenTime: 32.948ms
- ProcessConjunctTime: 1.358ms
- ProjectionTime: 0ns
- RowsProduced: 209.147K (209147)
- RowsRead: 209.147K (209147)
- RuntimeFilterInfo:
- ScannerWorkerWaitTime: 3.20ms
- TabletNum: 4
- TotalReadThroughput: 0
- WaitForDependency[OLAP_SCAN_OPERATOR_DEPENDENCY]Time: 3s586ms
- WaitForRuntimeFilter: 0ns
VScanner:
- ReadColumns: [vessel_id, acquire_timestamp_format, acquire_timestamp, vessel_name, c_name, imo, mmsi, callsign, rate_of_turn, orientation, master_image_id
, lng, lat, source, speed, speed_km, vessel_class, vessel_class_name, vessel_type, vessel_type_name, draught, cn_iso2
, country_name, nav_status, nav_status_name, dimensions_01, dimensions_02, dimensions_03, dimensions_04, block_map_index, block_range_x, block_range_y, position_country_code2
, friend_foe, sea_id, sea_name, update_time, DORIS_DELETE_SIGN]
- PreEvaluatePredicates:
ComparisonPredicateBase(DATETIME, LE), column_id=1, opposite=false
ComparisonPredicateBase(TINYINT, EQ), column_id=37, opposite=false
- PerScannerRunningTime: [3s568ms, 2s994ms, 3s739ms, 3s463ms, ]
- PerScannerRowsRead: [52.50K, 52.17K, 51.76K, 52.72K, ]
- PerScannerWaitTime: [313.772us, 294.233us, 1.213ms, 1.198ms, ]
- PerScannerProjectionTime: [84.025ms, 30.847ms, 37.659ms, 53.429ms, ]
- BlockConvertTime: 0ns
- BlockFetchTime: 11s508ms
- DeleteBitmapGetAggTime: 0ns
- MemoryUsage:
- FreeBlocks: 32.82 MB
- NewlyCreateFreeBlocksNum: 0
- NumScaleUpScanners: 0
- ReaderInitTime: 127.752ms
- RowsDelFiltered: 0
- ScannerBatchWaitTime: 27.37us
- ScannerConvertBlockTime: 0ns
- ScannerCpuTime: 9s773ms
- ScannerCtxSchedTime: 2.741ms
- ScannerFilterTime: 23.516ms
- ScannerGetBlockTime: 13s534ms
- ScannerInitTime: 558.864us
- ScannerPrefilterTime: 0ns
- ScannerSchedCount: 16
SegmentIterator:
- BitmapIndexFilterTimer: 18.547us
- BlockConditionsFilteredBloomFilterTime: 21.995us
- BlockConditionsFilteredDictTime: 9.162us
- BlockConditionsFilteredTime: 3.335ms
- BlockConditionsFilteredZonemapRuntimePredicateTime: 0ns
- BlockConditionsFilteredZonemapTime: 3.59ms
- BlockInitSeekCount: 64
- BlockInitSeekTime: 3.583ms
- BlockInitTime: 8.333ms
- BlockLoadTime: 11s605ms
- BlocksLoad: 10.253K (10253)
- CachedPagesNum: 22.239K (22239)
- CollectIteratorMergeTime: 0ns
- CollectIteratorNormalTime: 0ns
- CompressedBytesRead: 0.00
- DecompressorTimer: 0ns
- ExprFilterEvalTime: 0ns
- FirstReadSeekCount: 20.922K (20922)
- FirstReadSeekTime: 105.249ms
- FirstReadTime: 1s362ms
- IOTimer: 0ns
- InvertedIndexFilterTime: 44.442us
- InvertedIndexQueryBitmapCopyTime: 0ns
- InvertedIndexQueryBitmapOpTime: 0ns
- InvertedIndexQueryCacheHit: 0
- InvertedIndexQueryCacheMiss: 0
- InvertedIndexQueryTime: 0ns
- InvertedIndexSearcherOpenTime: 0ns
- InvertedIndexSearcherSearchTime: 0ns
- LazyReadSeekCount: 0
- LazyReadSeekTime: 0ns
- LazyReadTime: 9s65ms
- NumSegmentFiltered: 0
- NumSegmentTotal: 8
- OutputColumnTime: 70.518ms
- OutputIndexResultColumnTimer: 4.154ms
- RawRowsRead: 10.487583M (10487583)
- RowsBitmapIndexFiltered: 0
- RowsBloomFilterFiltered: 0
- RowsConditionsFiltered: 0
- RowsDictFiltered: 0
- RowsInvertedIndexFiltered: 0
- RowsKeyRangeFiltered: 0
- RowsShortCircuitPredFiltered: 0
- RowsShortCircuitPredInput: 0
- RowsStatsFiltered: 0
- RowsVectorPredFiltered: 10.266571M (10266571)
- RowsVectorPredInput: 10.475718M (10475718)
- RowsZonemapRuntimePredicateFiltered: 0
- SecondReadTime: 0ns
- ShortPredEvalTime: 1.125ms
- TotalPagesNum: 22.239K (22239)
- UncompressedBytesRead: 0.00
- VectorPredEvalTime: 202.959ms
LoadChannels: