2.1版本,doris join聚合查询导致cpu使用增高

Viewed 66

be规格:
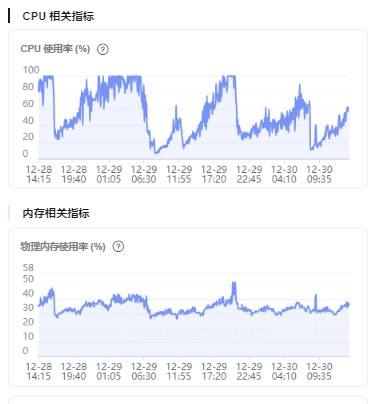
be 8u64g的机器,正常运行的时候cpu使用率只有20%左右。目前写入的数据比较少,查询的duplicate表table一天的数据量也就80g。

问题现象:
当使用比较多的连接聚合查询时,cpu使用率增加十分明显,三台机器高达95% cpu使用率,查询页面特别卡。但是导入数据是正常的。
使用sql语句每2-3分钟查询最近10分钟的数据,操作费时的主要是join聚合查询,大约有100个(可能都不到)。就是说配置超过一定数量的查询后,doris的cpu突然升高接近100%,查询基本无法使用。

把监控查询关闭后,doris恢复正常了。数据量和查询感觉并不是很大,为何发生这种情况?
看了下查询语句,是有走索引的,在cpu使用比较低的时候,执行sql响应挺快的。
打算把doris的基于普罗的监控配置下,Workload和sql查询限制隔离这些也配置上。
社区有没遇到这种类似情况的,怎么处理和优化,感谢!

sql基本这种:

select t1.time, 
ifnull(t2.success, 0) / t1.total as "successRate" from 
(select UNIX_TIMESTAMP(`@timestamp`) DIV 180 * 180 AS "time", 
count(*) as "total" 
FROM `table` 
WHERE `env` = 'xxx' 
and `@timestamp` BETWEEN FROM_UNIXTIME(1735615188) AND FROM_UNIXTIME(1735615428) 
and `uri` = '/rest/xxx' 
GROUP BY 1 
ORDER BY 1) as t1 
left join 
(select UNIX_TIMESTAMP(`@timestamp`) DIV 180 * 180 AS "time", 
count(*) as "success" 
FROM `table` 
WHERE `env` = 'xxx' 
and `status` < 400 
and `@timestamp` BETWEEN FROM_UNIXTIME(1735615188) AND FROM_UNIXTIME(1735615428) 
and `uri` = '/rest/xxx' 
GROUP BY 1 
ORDER BY 1) as t2 
on t1.time = t2.time 
order by 1

image.png

2 Answers

可以使用workload group来限制cpu的使用,可以在cpu高的时候top -Hp be_pid 看看cpu高的主要是哪些线程。

16u的3台机器,使用workload group限制cpu硬限90%后,云资源监控资源使用只有10%。为啥cpu使用率这么低,是我们的监控有问题么?
但是查询还是很卡,有时直接限流报错了。
数据量并不大,下面是be实例的cpu使用率。

top - 16:58:23 up 39 days, 7:09, 0 users, load average: 23.06, 18.78, 17.33
Threads: 1410 total, 22 running, 1388 sleeping, 0 stopped, 0 zombie
%Cpu(s): 8.2 us, 6.8 sy, 78.7 ni, 3.9 id, 0.0 wa, 1.6 hi, 0.8 si, 0.0 st
MiB Mem : 63890.0 total, 2190.4 free, 27419.3 used, 34280.4 buff/cache
MiB Swap: 0.0 total, 0.0 free, 0.0 used. 36983.3 avail Mem
PID USER PR NI VIRT RES SHR S SCPU %MEM TIME+ COMMAND
2410 service 25 99.3g 18.0g 37452 s 59.4 28.9 1955:06 Scan normal [wo
2407 service 25 99.3g 18.0g 37452 R 58.1 28.9 1954:22 Scan normal [wo
2418 service 25 99.3g 18.0g 37452 R 55.8 28.9 1953:58 Scan normal [wo
2423 service 25 99.3g 18.0g 37452 R 55.1 28.9 1955:07 Scan normal [wo
2404 service 25 99.3g 18.0g 37452 R 54.8 28.9 1955:54 Scan normal [wo
2406 service 99.3g 18.0g 37452 R 54.5 28.9 1957:02 Scan normal [wo
2405 service 99.3g 18.0g 37452 R 53.8 28.9 1955:45 Scan normal [wo
2419 services 25 99.3g 18.0g 37452 R 47.5 28.9 1955:43 Scan normal [wo
1012 service 20 99.3g 18.0g 37452 s 23.4 28.9 979:52.32 PipeGBlockSche-
1494 service 20 99.3g 18.0g 37452 s 16.2 28.9 4049:14 compaction task
735 service 20 99.3g 18.0g 37452 s 10.9 28.9 277:39.88 doris be
739 service 20 99.3g 18.0g 37452 S 8.6 28.9 248:30.98 doris be
736 service 20 99.3g 18.0g 37452 s 919 28.9 262:13.02 doris be
2833199 service 25 99.3g 18.0g 37452 s 5.9 28.9 0:00.30 RScan normal [w
741 service 20 99.3g 18.0g 37452 S 5.3 28.9 232:38.79 doris be
2397 services 1492 service 20 20 o .o 99.3g 99.3g 18.0g 18.0g 37452 s 37452 s 4.0 5.3 28.9 836:24.85 Pipe normal [wo 28.9 665:31.86 ColdDataCompact
1493 service 20 0 99.3g 18.0g 37452 s 4.0 28.9 671:14.98 ColdDataCompact
2400 service 20 0 99.3g 18.0g 37452 s 3.6 28.9 835:52.48 Pipe normal [wo
2392 service 20 99.3g 18.0g 37452 S 3.3 28.9 836:44.64 Pipe normal [wo
2395 service 20 99.3g 18.0g 37452 s 3.3 28.9 837:42.20 Pipe normal [wo
2833471 services 2391 service 25 20 ояоо 99.3g 99.3g 18.0g 18.0g 37452 s 37452 s 3.0 3.0 28.9 836:34.34 Pipe normal [wo 28.9 0:00.13 RScan normal [w
1923 service 20 99.3g 18.0g 37452 s 2.6 28.9 352:05.55 doris be
2390 service 20 0 99.3g 18.0g 37452 R 2.6 28.9 835:16.55 Pipe normal [wo
2393 service 20 99.3g 18.0g 37452 R 2.6 28.9 836:32.97 Pipe normal [wo
2396 service 20 0 99.3g 18.0g 37452 S 2.6 28.9 835:34.17 Pipe normal [wo
2399 service 20 0 99.3g 18.0g 37452 s 2.6 28.9 835:37.35 Pipe normal [wo
2832700 service 20 99.3g 18.0g 37452 s 2.6 28.9 0:04.54 MemTableFlushTh